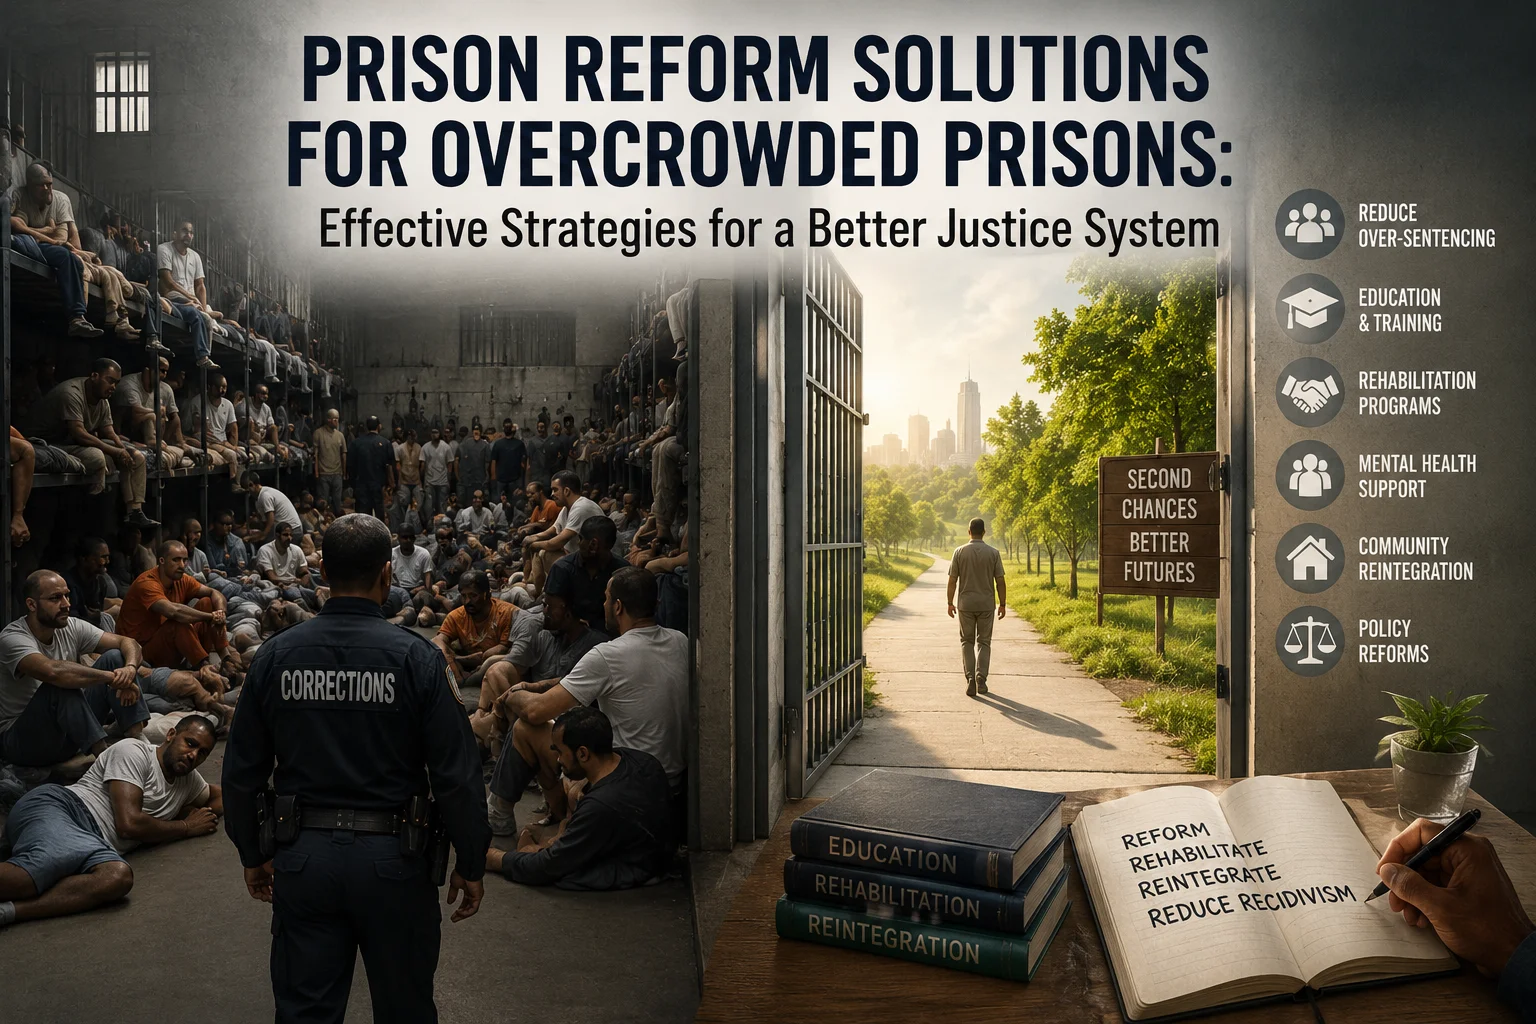
This page collects the core US prison reform statistics in one place, each with its source and year, so they can be checked and cited directly. Figures are drawn from the Bureau of Justice Statistics, the Prison Policy Initiative and the RAND Corporation. We update them when new primary data is published.
Scale of Incarceration
| Statistic | Figure | Source | Year |
|---|---|---|---|
| People incarcerated in the US on any given day | ~2.4 million | Prison Policy Initiative | 2026 |
| Incarceration rate per 100,000 residents | 580 | Prison Policy Initiative | 2026 |
| People under correctional control (incl. probation and parole) | 5+ million | Prison Policy Initiative | 2026 |
| Estimated annual fiscal cost of mass incarceration | $445 billion | Prison Policy Initiative | 2026 |
The US incarcerates at a higher rate than any other independent democracy. Note that these figures span prisons, jails, federal facilities, immigration detention and juvenile facilities — single-source figures often disagree because they count different slices of that system.
Recidivism
The most substantial US dataset follows roughly 409,300 people released from state prisons across 24 states in 2008, tracked for ten years.
| Statistic | Figure | Source |
|---|---|---|
| Rearrested within 3 years of release | 66% | Bureau of Justice Statistics |
| Rearrested within 10 years of release | 82% | Bureau of Justice Statistics |
| Returned to prison within 10 years | 61% | Bureau of Justice Statistics |
| Arrested during year 1 after release | 43% | Bureau of Justice Statistics |
| Arrested during year 10 after release | 22% | Bureau of Justice Statistics |
Important caveat when citing these: “rearrest”, “reconviction” and “reincarceration” measure different things and produce very different numbers. A programme claiming a low recidivism rate may be measuring reincarceration over two years rather than rearrest over ten. See our explainer on recidivism.
Education and Rehabilitation Outcomes
| Statistic | Figure | Source |
|---|---|---|
| Reduction in likelihood of reoffending among correctional education participants | 43% lower | RAND Corporation |
| Increase in post-release employment among education participants | 13% higher | RAND Corporation |
| Estimated return per $1 spent on prison education | ~$5 saved | RAND Corporation |
| Second Chance Pell students enrolled, 2016–2022 | 40,000+ | US Dept. of Education / DOJ |
| Credentials earned through Second Chance Pell, 2016–2022 | ~12,000 | US Dept. of Education / DOJ |
| Pell Grant eligibility fully restored to incarcerated students | July 2023 | US Dept. of Education |
A methodological note worth reproducing if you cite these: people who volunteer for education programmes may differ systematically from those who do not, which complicates causal claims. The consistency of direction across studies is the stronger argument than any single percentage.
Where These Figures Come From
If you are researching this topic, these are the primary sources worth going to directly rather than relying on secondary reporting.
- Bureau of Justice Statistics (BJS) — the federal statistical agency for criminal justice. The authoritative source for recidivism, prison population and correctional data.
- Prison Policy Initiative — produces the annual Whole Pie report, the standard reference for the total incarcerated population across all facility types.
- Federal Bureau of Prisons — current federal population statistics, updated frequently.
- RAND Corporation — the correctional education meta-analysis underpinning most education policy arguments.
- The Sentencing Project — sentencing policy research and state-level analysis.
- Vera Institute of Justice — jail and prison population data, including county-level detail.
- Brennan Center for Justice — policy research on criminal justice reform, based at NYU School of Law.
- Equal Justice Initiative — legal advocacy and research on sentencing and prison conditions.
- National Institute of Justice — the research arm of the Department of Justice.
How to Cite This Page
You are welcome to cite or link to this page. Where a figure originates with BJS, RAND or the Prison Policy Initiative, please credit the original source as well — each is linked above.
Show N Prove. “Prison Reform Statistics: US Data and Sources.”Prison Reform Statistics: US Data, Sources and ResearchAccessed [date].
Frequently Asked Questions
How many people are in prison in the US?
About 2.4 million people are held in US prisons, jails and detention facilities on any given day, at a rate of roughly 580 per 100,000 residents, according to Prison Policy Initiative figures for 2026.
What is the US recidivism rate?
Bureau of Justice Statistics data found 66% of people released from state prisons were rearrested within three years and 82% within ten years, with about 61% returning to prison over the decade.
How much does incarceration cost the US each year?
An estimated $445 billion annually once policing, courts, corrections and associated costs are counted, according to Prison Policy Initiative analysis.
Does prison education reduce reoffending?
RAND Corporation research found correctional education participants were 43% less likely to reoffend and 13% more likely to be employed after release, with an estimated saving of about $5 for every $1 spent.
Last reviewed August 2026. Figures are updated when new primary data is published.
Part of our complete guide to prison reform. See also mass incarceration explained and prison reform resources.
Table of Contents

Prison reform in the United States is one of the most urgent and complex challenges facing policymakers, advocates, and communities today. With over 1.9 million people currently incarcerated, the United States holds the world’s largest prison population — and the social, economic, and human costs are enormous.
This guide compiles the most important prison reform statistics, landmark studies, and authoritative resources to help advocates, researchers, journalists, educators, and policymakers understand the full scope of the issue — and what real reform looks like in practice.
Key Prison Reform Statistics (2024–2026)
Incarceration Rates
These prison reform statistics highlight the scale of mass incarceration in America:
- The U.S. incarcerates 531 people per 100,000 residents — the highest rate among developed nations (Prison Policy Initiative, 2024).
- More than 1 in 5 incarcerated people in the world are held in U.S. facilities.
- Black Americans are incarcerated at 5 times the rate of white Americans (NAACP, 2025).
- Women represent the fastest-growing incarcerated population, increasing by over 700% since 1980.
Recidivism
- Approximately 68% of released prisoners are arrested again within 3 years (Bureau of Justice Statistics).
- Within 5 years of release, 76.6% of prisoners are re-arrested.
- States that invest in education and vocational programs see recidivism rates drop by up to 43% (RAND Corporation).
Economic Cost
- The U.S. spends over $80 billion annually on corrections.
- The average cost to incarcerate one person for one year is $35,000–$60,000, depending on the state.
- Every dollar invested in prison education programs saves $5 in reincarceration costs (RAND, 2013).
What the Research Says About Effective Reform
Beyond the prison reform statistics above, decades of criminological research point to specific interventions that consistently reduce reoffending.
1. Education Programs Reduce Recidivism
The RAND Corporation’s landmark study found that incarcerated people who participate in educational programs are 43% less likely to return to prison than those who do not. Vocational training is equally powerful — participants are 28% more likely to find employment after release.
This is exactly why Show N Prove’s programs prioritize education and skill-building — because the data backs it up.
2. Mental Health Treatment Is Critical
An estimated 20% of prisoners have a serious mental illness, yet fewer than half receive adequate treatment. Studies consistently show that community-based mental health treatment is both more effective and less expensive than incarceration for non-violent offenders.
3. Family Connection Reduces Reoffending
Research from the Minnesota Department of Corrections found that prisoners who received visits from family members were 13% less likely to reoffend after release. Strong family ties are one of the most consistent protective factors across all studies on reintegration.
4. Employment After Release Is the Biggest Predictor of Success
Formerly incarcerated individuals face an unemployment rate of 27% — higher than any U.S. recession peak. Removing barriers to employment — through ban-the-box policies, vocational training, and entrepreneurship programs — dramatically improves outcomes.
Landmark Prison Reform Legislation
- First Step Act (2018) — Bipartisan federal legislation that reduced mandatory minimum sentences, expanded good-time credits, and improved prison conditions.
- Second Chance Act (2008) — Provided federal funding for reentry programs, drug treatment, and housing assistance for released prisoners.
- Prison Litigation Reform Act (1995) — Established procedures for prisoner civil rights lawsuits.
- Pell Grant Restoration (2023) — Restored access to Pell Grants for incarcerated students, reversing a 30-year ban.
Authoritative Resources on Prison Reform
The following organizations and research institutions are leading voices in criminal justice and prison reform, publishing some of the most cited prison reform statistics in the field. We’ve compiled these for advocates, students, journalists, and policymakers looking for credible data and solutions:
Research & Policy Organizations
- Prison Policy Initiative — Leading source of incarceration statistics and policy analysis.
- The Sentencing Project — Research and advocacy on sentencing reform and racial disparities.
- RAND Corporation — Peer-reviewed research on correctional education, rehabilitation, and recidivism.
- Bureau of Justice Statistics — Official U.S. government data on crime, courts, and corrections.
- ACLU Smart Justice — Litigation and advocacy for ending mass incarceration.
Reentry & Rehabilitation Organizations
- Heart of America Foundation — Prison library and literacy programs.
- National Reentry Resource Center — Federally funded hub for reentry research and best practices.
- Show N Prove Coalition — Community-based programs in mindset development, family empowerment, entrepreneurship, and reintegration support for justice-impacted individuals.
How You Can Get Involved
Prison reform is not just a policy issue — it is a community issue. Here are practical steps anyone can take:
- Educate yourself and others — Share this resource guide with your network.
- Contact your representatives — Advocate for sentencing reform, reentry funding, and Pell Grant access.
- Support reentry organizations — Donate to or volunteer with organizations like Show N Prove that provide direct services.
- Hire formerly incarcerated individuals — Employment is the #1 factor in successful reintegration.
- Stay informed — Follow the resources above for the latest research and policy developments.
Conclusion
The data is clear: these prison reform statistics show incarceration without rehabilitation fails individuals, families, and communities. Evidence-based prison reform programs — education, mental health treatment, family connection, employment readiness — work. They reduce recidivism, save taxpayer money, and strengthen communities.
At Show N Prove, we believe transformation is possible — and we prove it every day. Join the coalition and be part of the change.
New to this topic? Start with our complete guide to what prison reform means.